Pages

Wednesday, 4 December 2019

Monitoring VMware Cloud on AWS vCenter alarms within vRealize Log Insight Cloud

vRealize Log Insight Cloud (vRLIC) gives us unified visibility across public and private clouds through robust log aggregation, analytics and faster root cause determination. The great news is that it is also included as part of your subscriptions to VMware Cloud on AWS (VMC) and as of VMworld Europe 2019 also now includes additional features and functionality:


Check out the official blog article here

With the core version, VMC customers now get access to real-time reporting which is what we are going to look at today. In a previous post, I talked using creating VMC vCenter alarms and setting notifications for specific events. The event we were particularly interested in was if the VSAN datastore reaches 70% utilisation because at 75% a new host will be added to ensure we stay within SLA. In the example, we used an alert that would trigger if the datastore was less than 100% utilised as this would ensure the alert would always trigger. We are now going to use vRLIC to query for the alert and then send us a notification once it has been triggered.

vRLIC is automatically configured to ingest logs for VMC and can be accessed via the Cloud Services Portal so there is nothing that you need to do to start using it, simply launch the application:


The initial landing page gives us a great overview of recent alerts and event observations over the last hour. It is definitely worth spending some time with vRLIC to see the level of information and default alerts that are available to VMC customers:


I've re-created the vCenter alert that triggers when VSAN Datastore Usage is below 100 percent just to ensure the log is sent instantly to vRLIC:


If we explore the logs and query for the alert name VSAN Datastore Usage is below 100 percent with a timeframe of the last ten minutes then we can see the triggered alert. We know this is the alert because we can see it change its state from Gray to Red:


Now that we have the query needed we can click on the save icon:


Give the query a suitable name and description and click Save:


Once we save the query we can click on the alert icon to create an alert based on the query:


Give the alert a suitable name and description and click Save:


The Alert Definition screen will appear which will allow you to customise the alert. Remember to add the Email address where you would like the alert to be sent, set the trigger to evaluate on every match and enable it before clicking on the save icon:


It's also worth sending a test alert to ensure you receive the notification:


Hopefully, if everything is set up correctly next time the alert is triggered you should receive a notification via email and also see it in the Recent Alerts:


With the example above we are triggering an email notification when we see any log that has been ingested and contains the text, VSAN Datastore Usage is below 100 percent. This is not ideal because it will also trigger the notification when any changes to the alarm are made i.e. reset to green or disabling and re-enabling. I tried testing this on alarm name as well as the text gray to red which is sent when the state of the alarm changes but during testing, I noticed that this was not always sent on certain alarm configuration changes which I have fed back to the BU and will be addressed in the future. I don't envisage these changes being made regularly in customer environments so it should not cause an influx of emails.

A point that I would like to highlight is that vRLIC currently runs out of one of the US AWS regions so if there are issues with logs residing outside of the UK/EU then please get in touch and I will continue to raise this internally.

Monday, 2 December 2019

VMware Cloud on AWS vCenter Alarms

A lot of VMware customers use vCenter alarms and notifications for monitoring their on-premises environment and the same goes for when they move to VMware Cloud on AWS. I was recently asked by a customer on how they can receive a notification when the VSAN storage capacity is getting close to 75% full. For those who are not aware we need 25% slack space for VSAN and will automatically add a host once storage utilisation reaches 25%, which is documented in the Service Level Agreement for VMware Cloud on AWS.

Creating an alarm can either be completed directly in the vCenter client or via the Cloud Gateway Appliance. Simply browse to the WorkloadDatastore, select Configure and then Alarm Definitions. From here you need to Add a new alarm:


Give the alarm a suitable Name and Description and click Next:


In the example, I am setting the alarm to be triggered if the utilization is less than 100% (Which will always be the case) to ensure that I receive a notification. Typically you would set this to is above 70% or whatever threshold you feel comfortable with. Once you have the correct parameters enter the email address to whom you would like the notification sent to and click Next:


Set the email notification if you want to be notified once the condition clears otherwise click Next:


Review your settings and click Next when ready:


Since our alarm was set to trigger if storage utilisation was less than 100% we can see that it triggered straight away within vCenter:


We also received an email notification:


Since currently there is no sender address there is a chance this might get picked up by your email spam filtering software so you might have to create a rule to allow it through. Due to this annoyance in the next article, I will show you how to trigger an alert from vRealize Log Intelligence Cloud.

Wednesday, 16 October 2019

Adding vCenter Cloud Gateway Proxy Exceptions

I was recently asked about whether or not we could add proxy exceptions to the vCenter Cloud Gateway appliance to ensure that all local traffic i.e. traffic to the on-premises vCenter does not go through the corporate proxy. For those who are not aware, the vCenter Cloud Gateway allows Hybrid Linked Mode between an on-premises vCenter and a vCenter residing in VMC without the requirements on opening specific ports from VMC back to on-premises. The only ports that are required are TCP/443 and TCP/902 as per the pre-requisites:


When checking the VAMI interface on the vCenter Cloud Gateway appliance the only options for proxy are enabling or disabling for HTTP, HTTPS and FTP, there is no option to add exceptions:


To add exceptions you need to use the API. The get the list of current proxy exceptions you can use:

GET https://<Cloud Gateway IP>:5480/rest/appliance/networking/noproxy

If you want to add entries you can do a PUT against the following URL:

PUT https://<Cloud Gateway IP>:5480/rest/appliance/networking/noproxy

with the following JSON:

{
    "servers": [
        "localhost",
        "127.0.0.1",
        "10.0.0.0" ** Add networks that require exception **
    ]
}

localhost and 127.0.0.1 are always added

In the below example I GET the current list of proxy exceptions:


I then PUT two new exceptions into the list (10.0.0.0 and 192.168.1.0):


Then finally do another GET to show the full list:

Saturday, 24 August 2019

North East VMUG - Thursday 26th September

The next North East VMUG event has officially been announced and registration is open. The event will take place on Thursday 26th September at the Royal Station Hotel. It's conveniently located right next to Newcastle Central station and directions can be found here. The guys have pulled out all the stops and arranged a great selection of sponsor and community sessions. Just check out the list of rockstars who will be at the event:

Keynote Sessions

Matt Steiner (Blog | Twitter) - Cloud Management Evangelist/Strategist, VMware
Session - Are you the Platform Engineer of the Future who will #ManageAllTheThings?

As we enter the Multi-Cloud era, the traditional roles in IT are changing. In this talk, we look at how the landscape is changing, and at the Cloud Management technology that is supporting this change. We will talk APIs, Infrastructure as Code, Platforms as Code, Everything as a Service, how you truly can #ManageAllTheThings, and become the Platform Engineer of the Future.

Lee Dilworth (Twitter) - Chief Technologist Storage & Availability, VMware
Session - To be confirmed


Community Sessions

Ricky El-Qasem (Blog | Twitter)
Session - Automation: you're the first, the last, my everything)

A talk about how everything in your IT could and should be automated. Discussing how different facets of automation can help you nail down everything that can be automated, some next gen automation with AI and showing off a new tool in prototype he has been working on to help automate cloud templates.

Gareth Lewis (Blog | Twitter)
Session - VMware NSX Data Centre for vSphere (NSX-V): Micro-Segmentation from the Field

A real-world look at the micro-segmentation of applications with the aid of VMware NSX-V and the NSX Application Rule Manager. By visualising application dependencies, endpoints and services, we can implement a zero-trust environment and prevent lateral network exploits thanks to the Application Rule Manager and NSX Distributed Firewall.

Sam McGeown (Blog | Twitter)
Session - Getting Started with Kubernetes and the NSX-T container network plugin

A hands-on demonstration configuring the NSX-T container plugin with Kubernetes. Minimal slides and maximum command line.

These event would not be possible if it wasn't for the sponsors so a big shout out to them all:

Gold Sponsors

Dell Technologies
Arcserve
HTG

Silver Sponsors

ExaGrid
Exponential-e

Remember to secure a pass out from the other half because the event is only half the fun. vBeers will be held at The Town Wall straight after the event and continue into the night. Be sure to be first in line for the legendary scotch eggs before they disappear.

Wednesday, 29 May 2019

Docker Desktop for Windows running in VMware Cloud on AWS

I had an interesting request from a customer who is potentially looking to move some developers desktops from on-premises into VMC accessible via Horizon 7 but had a requirement to run docker on the Windows 10 desktops and asked if it was possible.

Since Docker uses some functionality of HyperV on Windows 10 I had my doubts but figured I would try it out. In order for this to work you need to enable Virtualization Based Security within the guest VMs settings:


Once you have enable this Docker Desktop for Windows should start successfully and you should be able to run docker images:

Monday, 13 May 2019

Scaling up your single node VMC SDDC

For those of you who don't know, VMware Cloud on AWS offers you the ability to deploy a one node SDDC for testing purposes. These are ideal for POCs or pilots and can very easily be scaled up to a production grade SDDC with the click of a button. So, what exactly is the Single Host offering? Our VMware Cloud on AWS FAQ tells us the following:

What is the Single Host SDDC offering?
With the new time-bound Single Host SDDC starter configuration, you can now purchase a single host VMware Cloud on AWS environment with the ability to seamlessly scale the number of hosts up within that time period, while retaining your data. The service life of the Single Host SDDC starter configuration is limited to 30-day intervals. This single host offering applies to customers who want a lower-cost entry point for proving the value of VMware Cloud on AWS in their environments.

When helping customers with POCs/pilots who want to validate the solution and use cases before purchasing they often want to move the SDDC from a POC/pilot stage into a fully fledge production grade SDDC. A lot of work goes into setting up the pilot which might include:
  • Connectivity to on-premises either via VPNs or Direct Connect.
  • Setting up and configuring various add-on services such as Hybrid Cloud Extension (HCX) and Disaster Recovery as a Service.
  • Various infrastructure workloads might have already been deployed such as Authentication Services, DNS, NTP, Backups, Native AWS integration etc.
It's at this point that I feel I should mention that you should absolutely avoid running production workloads on a single node SDDC due to the lack of redundancy in both the compute and storage layers. If the host fails you could potentially lose data since it's a single host and VSAN doesn't have the ability to ensure your data is stored on multiple hosts.

One of the mains reason for scaling up a POC/Pilot is when you destroy the SDDC the various public IP's are also handed back to AWS which means any VPNs (Policy or Route based) configured would need modifying and if the customer has strict change control processes or the firewalls are managed via a 3rd party there might be additional delays and costs associated with the changes. 

For this article I used a single node SDDC running version 1.6 Patch 01. For future SDDC versions we may change the way the scale up process works.


When you have a single node SDDC that you want to scale up to a production grade three node SDDC there are a few things that you need to take into consideration:

AWS Account
You need to ensure that you have linked your SDDC to your AWS account if you didn't already do this when your deployed your SDDC. Single node SDDC's have a grace period of 14 days before you need to connect them to your AWS account but if you want to scale it up you need to ensure that it's linked before you initiate the process. To check whether your SDDC is linked to an AWS account go to your SDDC, select Networking & Security and select Connected VPC:


If your SDDC isn't connected then go through the process to complete this.

VSAN Storage Policies
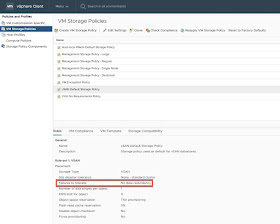
When you deploy a single node the default VSAN VM policy is set to No Data Redundancy since there is only a single node we are unable to store data on multiple nodes:


We can see that all our workload and management VMs are using the default policy are are currently compliant with the policy:


Subscriptions
Either before or after scaling up your SDDC to get the best value of discount you need to create a subscription. Subscriptions allow you to save money by committing to buy a certain amount of capacity in a specific region for a defined period, either 1 or 3 years, and a subscription is not required to use VMware Cloud on AWS. Any usage of the service not covered by a subscription is charged the at on-demand rate:


Page 10 in the VMware Cloud on AWS Getting Started guide shows you the process in creating a subscription and you can find more information about our pricing on public facing site here.

Scaling Up
In order to scale up your one node SDDC simply click on the Scale Up button:


A confirmation screen is displayed showing what your current environment looks like and what the new environment will look like once completed. If you are happy to proceed then click on the Scale Up Now button:


The scale up process will start and typically takes about 20 minutes (~10 minutes per host)


You can continue to use the environment and you will notice that within vCenter new hosts are automatically added in maintenance mode and then taken out of maintenance mode:


Eventually the two additional hosts will be added and available to use. The scale up process is complete and you will have a fully supported three node SDDC:


As part of the scale up process we change the VSAN storage policy for the management workloads from being in the VSAN Default Storage Policy to being in the Management Storage Policy - Regular which supports FTT=1 (RAID1):


Within about 20 minutes VSAN will bring the VMs into compliance and ensure data is stored on two different hosts:


We also modify the VSAN Default Storage Policy to ensure we use FTT=1(RAID1):


This will bring all workloads that currently use this policy into compliance within about 20 minutes (Depending on the number of workloads you have running within the environment)


Once this process has completed you are fully in support and running a production grade three node cluster.

One thing I have noticed is that you will see a warning about management network redundancy on the original one node. This alert was present before we scaled up but we currently don't have the ability to suppress it so you will have to initiate a support request via chat to have this suppressed. I will log this internally to suppress the warning as part of the scale up process: